Major programs don’t fail suddenly.
They drift through small, unnamed risks in systems, behaviour, and decision-making — compounded by untested assumptions and reporting that measures activity more than reality.

Despite greater investment in professional development, governance, and processes, programs exceeding $15 million still fail or suffer significant distress at high rates.
We identify the structural, behavioural, and governance signals that traditional oversight misses.
Most organisations don’t ignore these signals because they lack intelligence.
They miss them because the signals don’t look dangerous — until they are.
Most organisations increase oversight only after risk has already grown.
We examine why the risk grew in the first place.
High Stakes
Low Success
Despite greater investment in professional development, governance, and processes, programs exceeding $15 million still fail or suffer significant distress at high rates.
Correcting Course Before It’s Too Late
Princeton Lee helps senior leaders:
Stress-test decisions,
Surface hidden risks early, and
Adjust course before problems become crises.
We engage when the stakes are high, commitments are public, and the costs of being wrong are significant — financially, operationally, or reputationally. By the time warning dashboards start flashing red, the opportunity for quiet course correction has usually closed.
Princeton Lee employs an evidence-based framework that objectively measures program resilience across three key areas: Systems, Behaviour, and Decision-making. This framework is developed from an analysis of thousands of programs conducted between 2004 and 2024.
We identify the procedural gaps, behavioural pitfalls, and cognitive blind spots that frequently hinder successful delivery.
The Value
Gap
82% of major programs fail to deliver the expected value.
The question isn’t whether drift begins — it’s how long it remains unrecognised. In many cases, the early indicators are present; they’re just not connected.
Changing The Dynamic
We intervene before systemic risks affect financial results, attract regulatory attention, or lead to public consequences.
Our approach doesn't eliminate risk; instead, we identify it early, allowing you to act from a position of strength. This helps turn the likelihood of a "Very Low" satisfaction outcome into one that meets your organisation's and stakeholders' expectations.
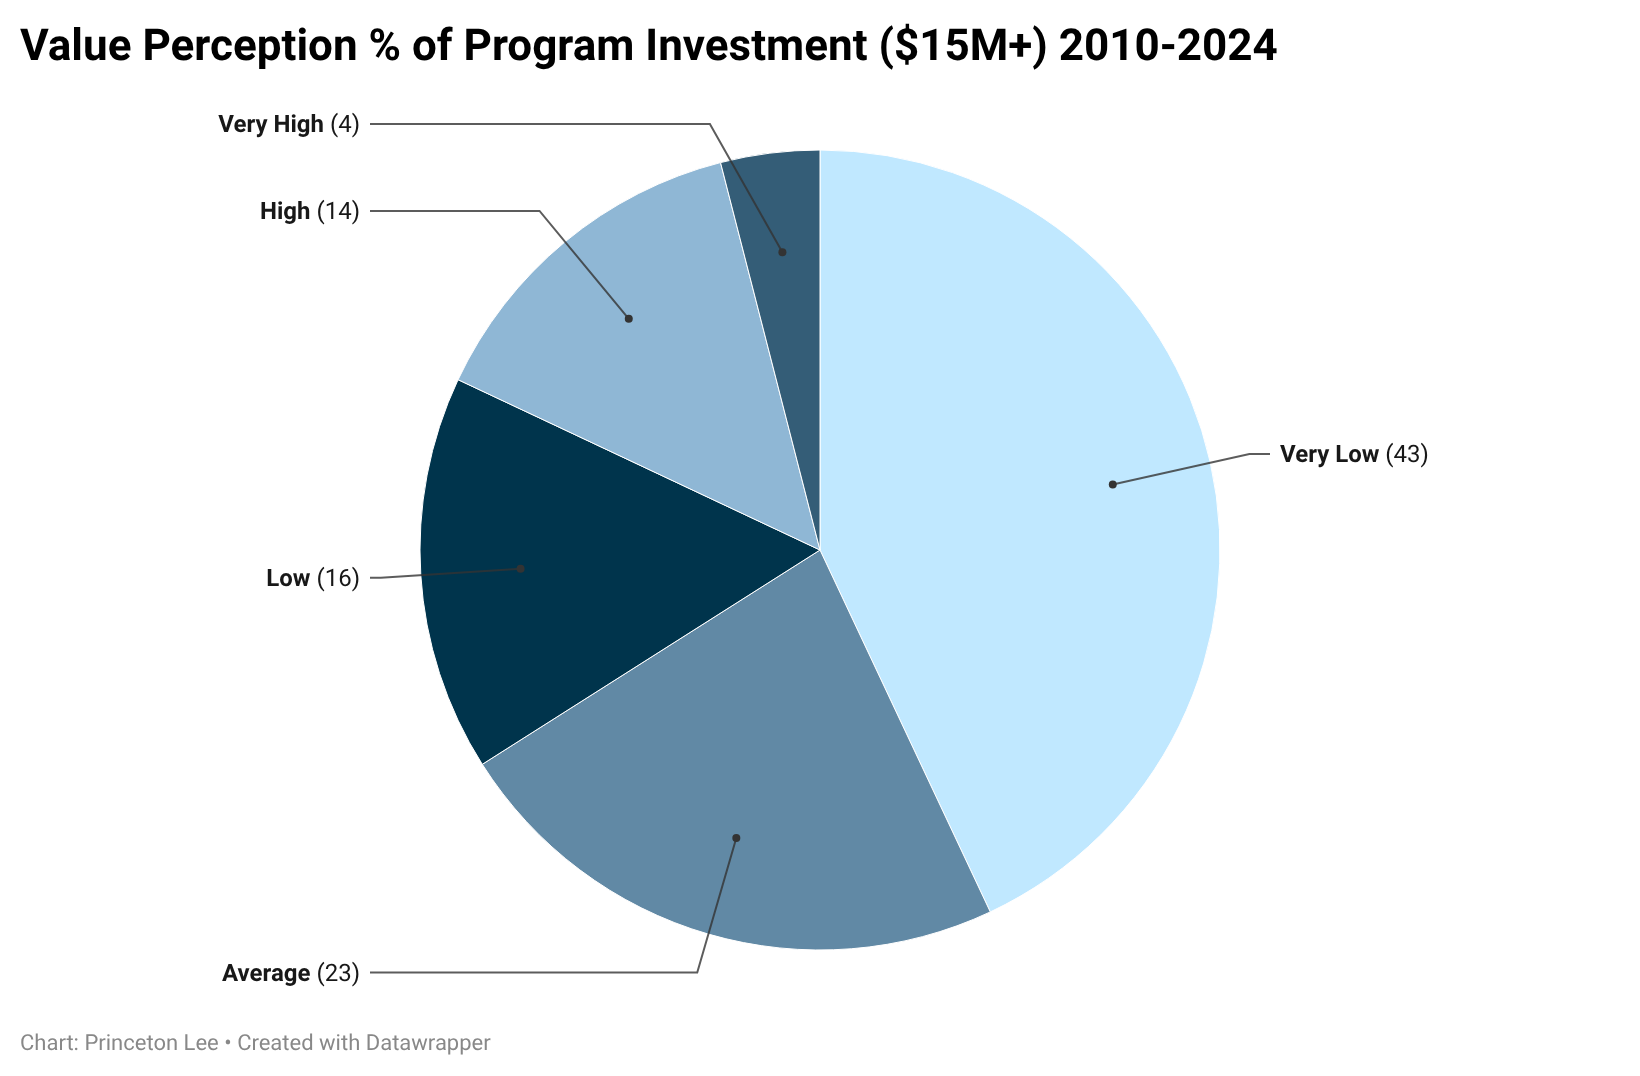
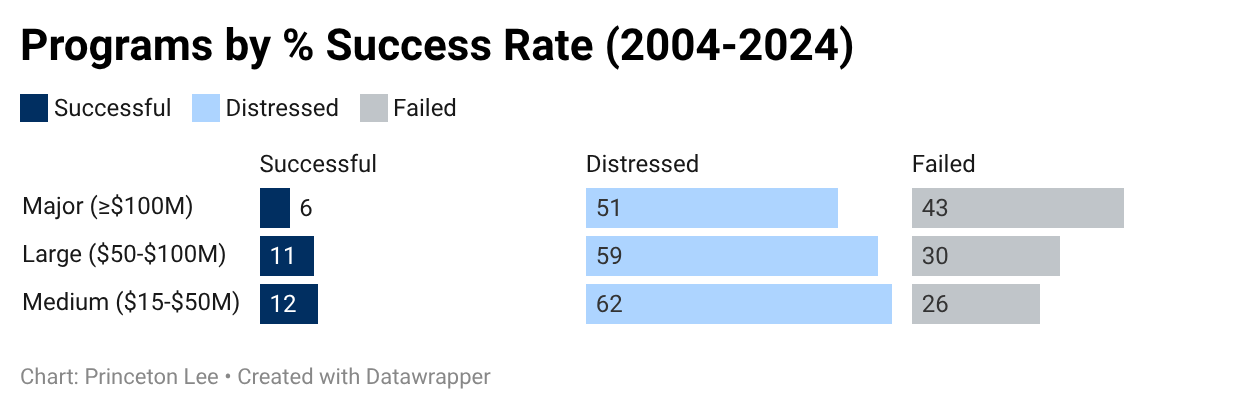
Over the past 15 years, few programs exceeding $15M have delivered high or very high value relative to their investment. Most initiatives underperform: 43% deliver very low value, and nearly two-thirds fail to meet even average expectations despite significant investment, skilled teams, and strong governance.
This isn’t a failure of capability or effort, but of visibility. By the time value erosion becomes apparent in reporting, the options for meaningful intervention have already narrowed.
No Safe
Sectors
From 2004 to 2024, across every sector, fewer than 1 in 3 programs succeeded. The other 70% were distressed or failed.
Yet governance kept reporting green.
Interrupting The Failure Cycle
The consistent patterns of failure across sectors indicate that this issue is not limited to a single industry; rather, it reflects a universal gap between reported outcomes and actual outcomes.
Princeton Lee’s value lies in his ability to identify behavioural and structural warning signs relevant across sectors, including banking, healthcare, and major public-sector programs.
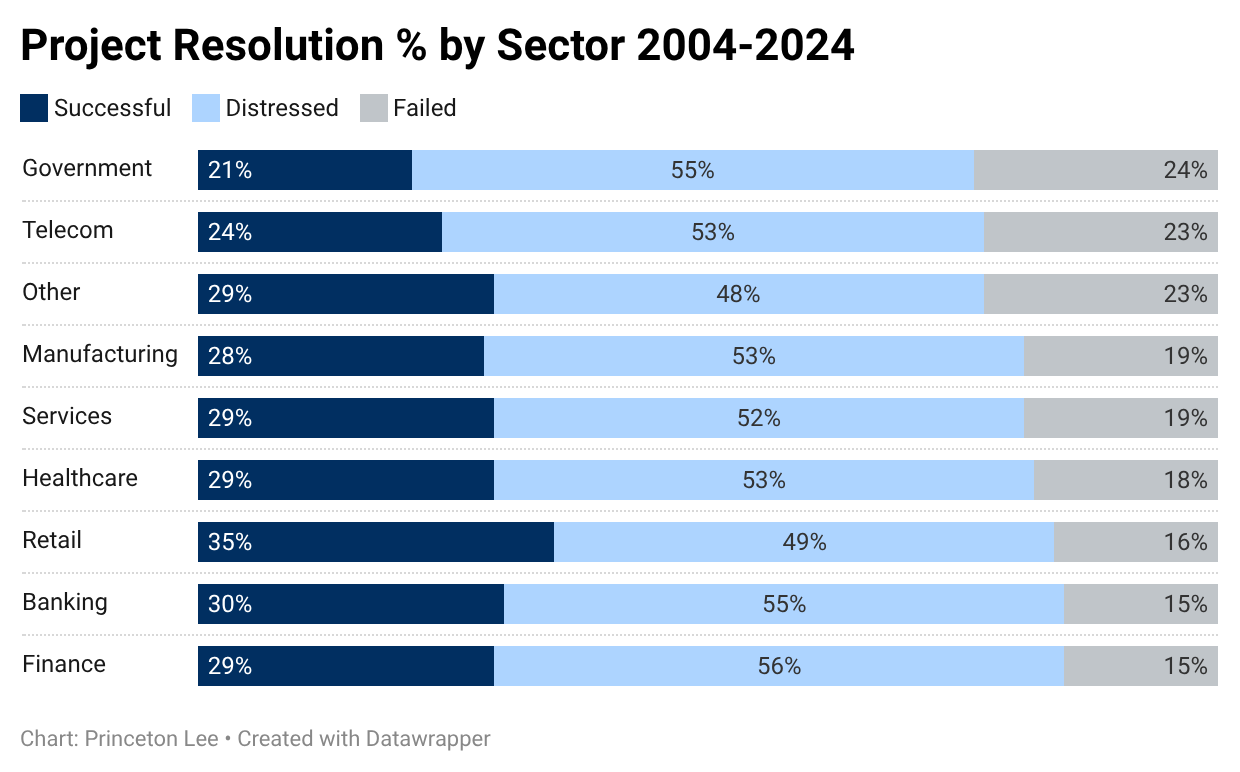
In the past two decades, no sector has achieved a success rate above 35%, with the government and telecom sectors facing the lowest rates at 55% and 53% distress/failure, respectively. Even in retail — the best-performing sector — nearly two-thirds of major programs struggle or fail.
The pattern is consistent: 70-79% of major programs face significant distress or failure, regardless of industry, regulatory environment, or complexity. This issue is systemic across all organisational contexts.
Separating Success
From Failure
The largest performance gaps are behavioural and leadership factors.
Precisely the areas that traditional governance doesn’t measure.
Improving The Odds for Success
We evaluate the key factors that distinguish successful programs from those that fail, focusing specifically on the level of executive engagement and the behavioural patterns that signal a program may be at risk.
By identifying these patterns early, we enable timely, feasible course corrections while maintaining available options.
This approach provides you with valuable insights to protect both your investment and credibility.
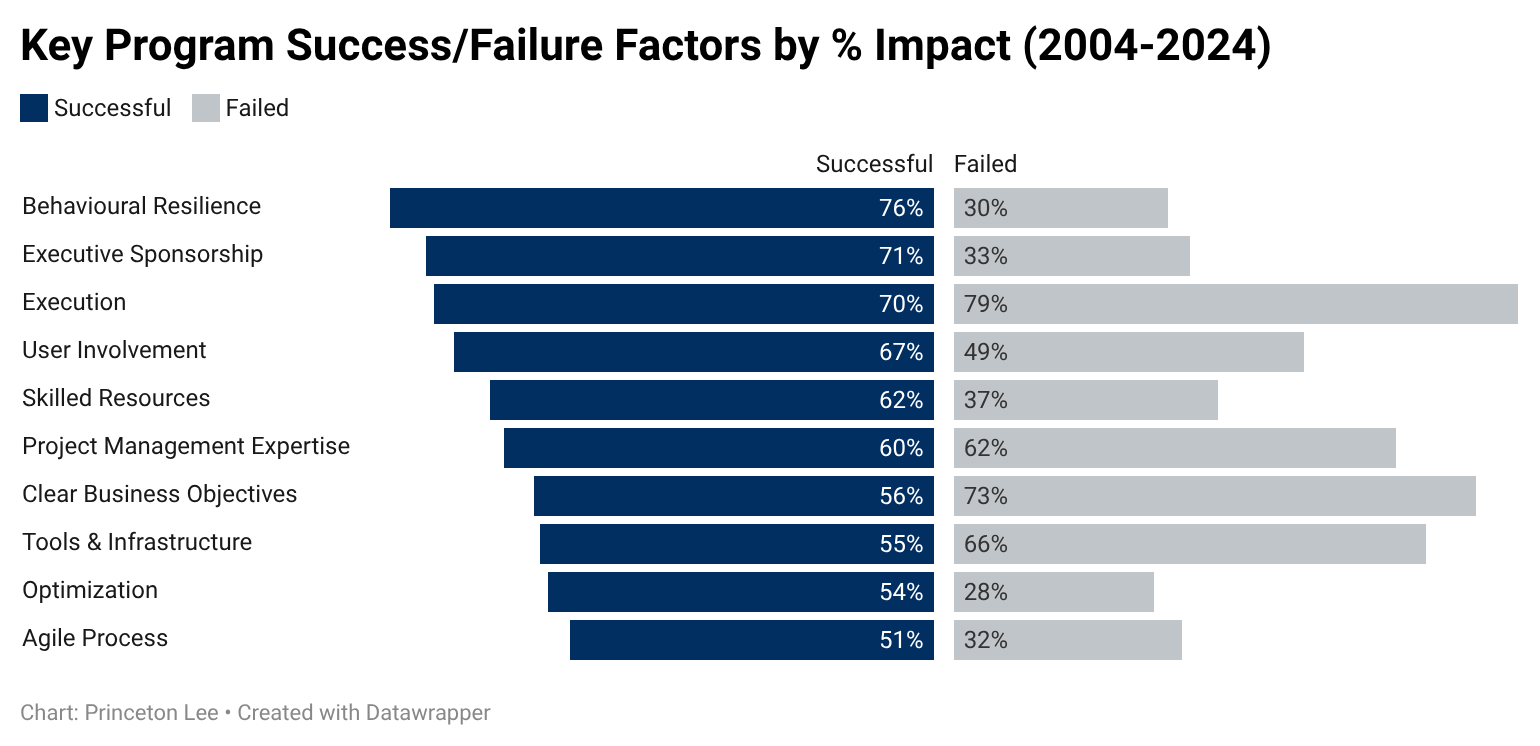
Successful programs are characterised by strong executive sponsorship and, more importantly, by a resilient, mature, and honest management team that actively engages with its stakeholders.
Most programs do not fail because of process or technical issues. Instead, they fail when leadership engagement diminishes, teams struggle to address or report uncomfortable truths, and behavioral dysfunction becomes ingrained in the program's progress.
The Clarity
Paradox
In failing programs, governance intensifies. Reporting increases. Controls expand.
Yet outcomes remain unchanged.
Giving You The Advice You Need
We assess whether delivery is still creating value or merely sustaining momentum. We test relevance, detect drift, and identify when velocity begins to replace judgment.
This process exposes when continuation becomes automatic rather than earned, while intervention is still possible.
It is at this point that we deliver the advice you need to hear, not necessarily the advice you want to hear.
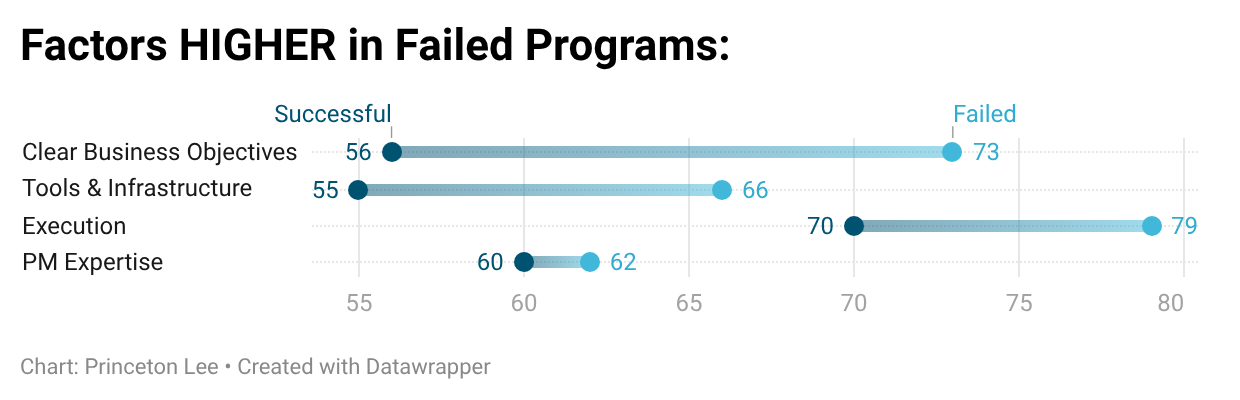
Failed programs often perform better than successful ones on governance indicators. Clear objectives, strong execution discipline, and robust tools are present, even more than in successful initiatives.
The problem isn't a lack of governance, but how it's applied. Structure takes the place of judgment, and reassurance masks honesty, leading to green dashboards over red realities.
The difference between success and failure is rarely effort. The earliest warning signs aren’t hidden; they’re inconvenient.
This is where we operate.